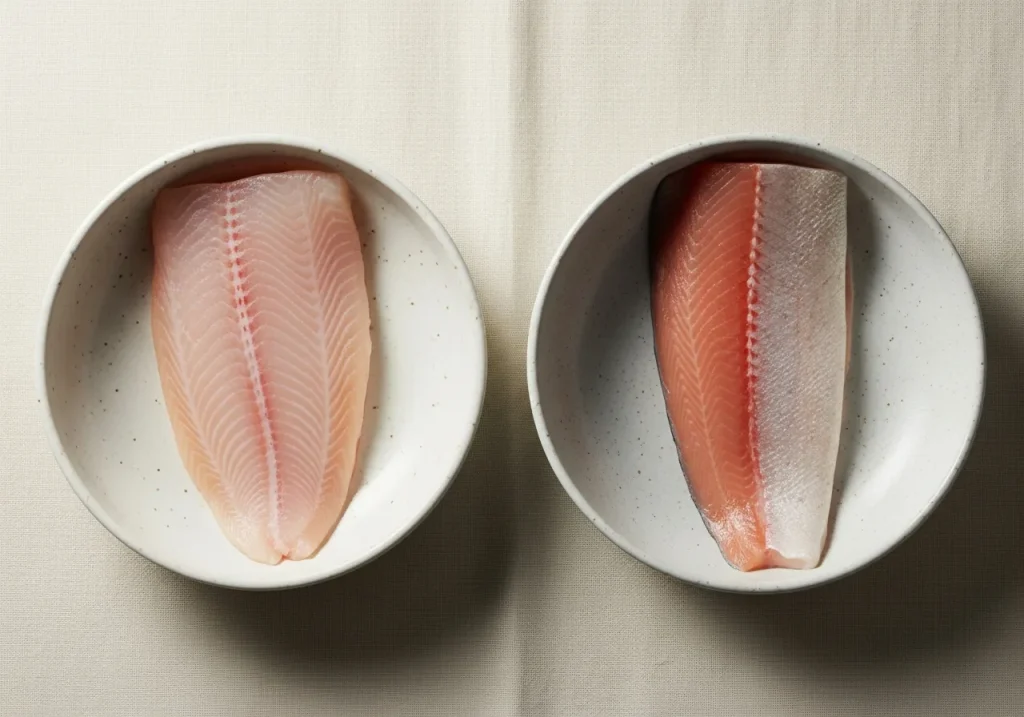
Two mild, widely farmed fish that turn up on the same “easy weeknight fish” shortlist — with a bigger nutritional gap between them than their similar reputations suggest.
| Nutrient | Tilapia | Rainbow Trout |
|---|---|---|
| Calories | 94.7 kcal | 141 kcal |
| Protein | 19 g | 19.9 g ✓ |
| Total Carbohydrate | 0 g | 0 g |
| Dietary Fiber | 0 g | 0 g |
| Total Sugars | 0 g | 0 g |
| Total Fat | 2.48 g | 6.18 g |
| Saturated Fat | 0.65 g ✓ | 1.38 g |
| Sodium | 93.7 mg | 51 mg ✓ |
Notable compounds in each
When to choose each
Rainbow trout carries more fat overall, including the omega-3s it’s well known for, which is a big part of why it’s the higher-calorie fish of the two — but that comes with more saturated fat too. Tilapia is the leaner option gram for gram, with less total and saturated fat, though it runs higher in sodium and very slightly lower in protein. Both are mild, versatile fish that work well pan-fried, baked or grilled.
Common questions
Is rainbow trout a good source of omega-3s? Yes — trout is a moderate, accessible source of omega-3 fats, not as concentrated as salmon or mackerel but meaningfully higher than lean white fish like tilapia.
Why is tilapia higher in sodium than trout? It varies by how the fish was raised and processed rather than being an inherent trait of the species — farmed tilapia in particular can pick up more sodium depending on feed and processing methods.